Statistics
Statistical skills
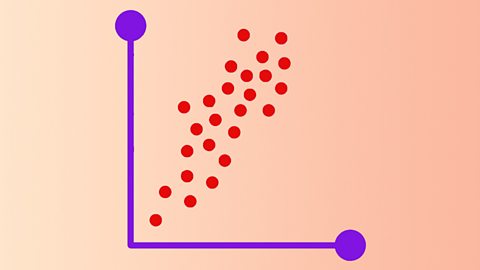
Scatter diagrams are used to investigate a relationship between two variables. A line of best fit is often used to show any relationship. This is then used to help make estimations on future results.

Video playlist
The Approximate History of Probability. Video
An animated look at probability in maths.

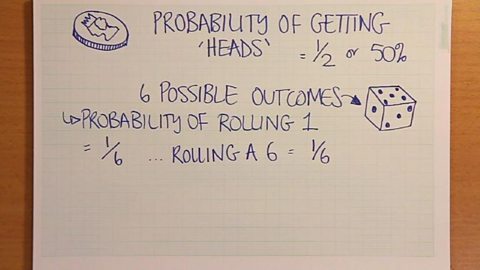
Bitesize maths: Probability. Video
An animated guide to probability.

Standard deviation. Video
An animated guide explaining how the standard devition can give you a clearer picture of a sample than averages alone.

Links
- External linkExternal link
- External linkExternal link
- External linkExternal link
- External linkExternal link