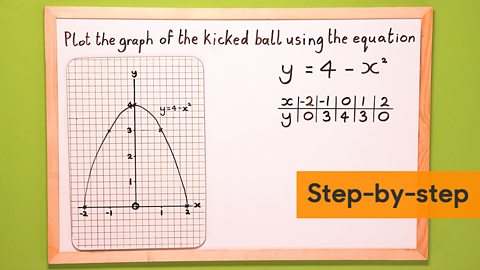
A quadratic equation is drawn as a curve on a set of axes. This type of curve is called a parabola and it is symmetrical.
To draw the graph we need coordinates.
We generate these coordinates by substituting values into the quadratic equation.
Learn how to draw a graph of a quadratic function
Plotting your graph
A quadratic equation is represented as a curve on a set of axes. In order to draw the curve on a graph we require several pairs of coordinates. These coordinates represent the relationship given in the equation.
Eg y = 4 – x²
The y value is always 4 subtract the square of x.
We can make a table of values to create the coordinates. We use substitution to calculate the values.
We replace the value of x for different numbers and record the resulting y value.
These coordinates can then be plotted on a graph.
Have a go

Image caption, Click to see a step-by-step slideshow.
1 of 8
More on Algebra
Find out more by working through a topic
- count23 of 29

- count24 of 29

- count25 of 29

- count26 of 29
