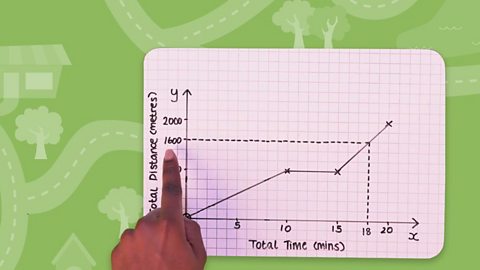
A travel graph is a line graph which describes a journey – it shows how distance changes with time.
Time is always represented on the x-axis and distance on the y-axis.
The distance is always distance from a particular place and the time is the time from the start of the journey.
Example
Emily cycles from her house to her Nanny’s.
The graph below shows her journey.
The journey is in three parts.
Blue line – this represents the first 30 minutes of the journey. Emily is 5 km from home after 30 minutes.
Red line – the time has increased by 5 minutes, but the distance has not increased. This means Emily stopped cycling for 5 minutes.
Green line – this represents the last 25 minutes of the journey. The whole journey has taken 60 minutes and Emily is now 12 km from home.
Question
a) What was Emily’s speed, in kilometres per hour, over the first part of the journey?
b) Did Emily cycle faster before or after she stopped for 5 minutes?
Answer
a) Emily cycled 5km in 30 minutes. In 60 minutes, she would cycle 10 km so her speed over the first part of the journey is 10 km/hr.
You could work out the speed after the stop but there is no need to do that.
b) Look at the blue line.
In the first 15 minutes, Emily has cycled 2.5 km.
Look at the green line.
In the first 15 of this part of the journey, Emily has cycled just over 4 km – more distance over the same time.
Emily cycled faster after she stopped for 5 minutes.
Note that the green line is steeper than the blue one.
Key point
On a travel graph, steeper lines indicate faster speeds.
Question
The travel graph below shows the McGrath family’s car journey from their home in Ballymena to Donegal.
a) The family stopped for a cup of coffee on the way. How long did they stop for?
b) What time did they arrive at their destination?
c) Did they travel faster before or after they stopped for coffee?
Answer
a) The straight line represents the time the family stopped.
Each square on the horizontal axis represents 10 minutes.
They stopped for 4 x 10 = 40 minutes.
b) Each square on the horizontal axis represents 10 minutes.
The family arrived 20 minutes before 1700, that is 1640.
c) They travelled faster before they stopped.
The line representing the first part of the journey is steeper than the line for the third part.
Test section
Jude sets out at 1100 to walk to his friend’s house.
They chat for a while and then he walks home.
Question 1
What time does Jude arrive home?
a) 1130
b) 1230
c) 1220
Answer
The correct answer is c) 1220.
Question 2
What was Jude’s speed on the way to his friend’s house?
a) 2 km/hr
b) 4 km/hr
c) 8 km/hr
Answer
The correct answer is b) 4 km/hr.
Question 3
How long did Jude and his friend spend chatting?
a) 2 minutes
b) 20 minutes
c) 10 minutes
Answer
The correct answer is c) 10 minutes.
Question 4
What was Jude’s speed on the way back from his friend’s house?
a) 3 km/hr
b) 4 km/hr
c) 2 km/hr
Answer
The correct answer is a) 3 km/hr.
More on Algebra
Find out more by working through a topic
- count21 of 29

- count22 of 29

- count23 of 29

- count24 of 29
